PICO-8
Guide
Guide Categories
Beginner Friendly Browsing
Audio Colors Commands Controls Editors Getting-started Loops Lua Maps Math Memory Save-export Screen Shapes Sprites System Tables Variables
The Official Manual is provided here for quick access. Our specific guide pages will also direct you to specific relevant sections of the Official Manual.
MAP
map( mx, my, [sx, sy,] [w, h,] [layers] )| mx | "map x" number of tiles from the left (8 pixels in 1 tile) |
| my | "map y" number of tiles from the top (8 pixels in 1 tile) |
| sx | (optional) "screen x" number of pixels from the left |
| sy | (optional) "screen y" number of pixels from the top |
| w | (optional) "width" number of tiles wide of the map to draw |
| h | (optional) "height" number of tiles tall of the map to draw |
| layers | (optional) a bitfield value referring to sprite flags to draw only the sprites with those flags |
It is possible to call map() without any arguments at all. This will draw the map with all default values:
map()
map(0, 0, 0, 0, 16, 16, 0) --default values
Both of the above lines of code will draw the map from its top-left corner (0,0) to the screen's top-left corner (0,0) for the entire width and height of one screen (16,16) and without specifying a sprite flag (0) meaning draw all sprites from the map.
![]()
Map Coordinates to Screen Coordinates
It is important to notice and understand which arguments take map coordinates (in number of tiles) and which take screen coordinates (in number of pixels). Here are some examples to help understand how to control what part of the map is drawn to what part of the screen.
For most games, you will simply want to draw the map exactly as it appears in the map editor and so you can use the default map() arguments. Here's how that works:
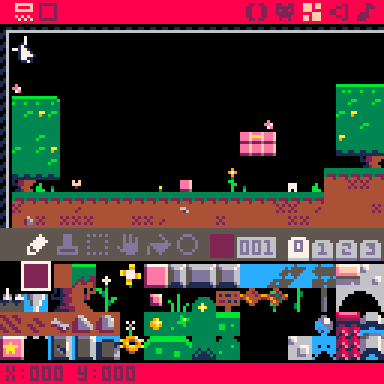
For these examples, we will use the demo game "Jelpi" made by zep, the creator of PICO-8.
Notice in the above image, when we hover the mouse over the top-left corner of the map editor, the X and Y coordinates at the bottom of the screen show as x:000 y:000 which means that tile's map coordinates are (0,0). Compare that to when we hover over this star tile, which shows x:020 y:008 which means the star tile's map coordinates are (20,8). Seen here:
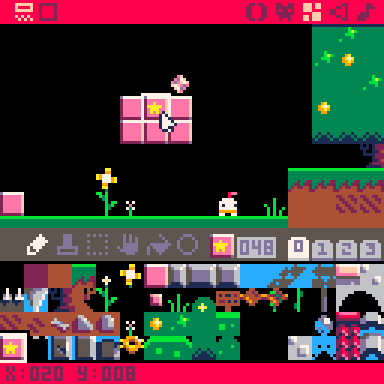
Those map coordinates means that the star tile is located at 20 tiles to the right and 8 tiles down from the top-left corner of the map. If we draw the map to the screen using the default arguments like this:
function _draw()
	cls()
	map()
end
Then the full width and height of the screen will be drawn with same width and height of the map, starting from the top-left corner of the map, and drawing to the top-left corner of the screen. If we replace all of Jelpi's code with only with the above draw function, this is what we get:
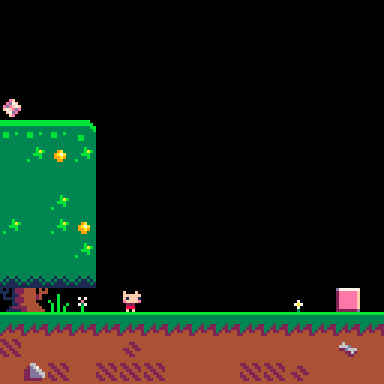
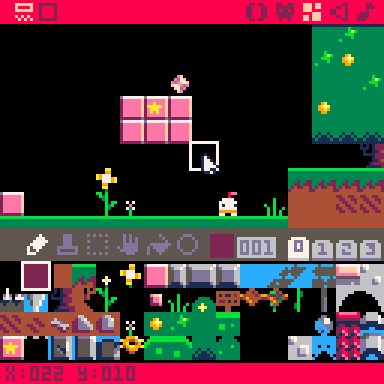
One screen is only 16 tiles wide, so we do not even see the star tile because it is at map column 20, 4 tiles farther to the right. Now lets use the map function to draw a more specific part of the map to the screen. Let's draw the pink bricks with the star instead. First find the map coordinates of the top-left corner of what you want to draw:
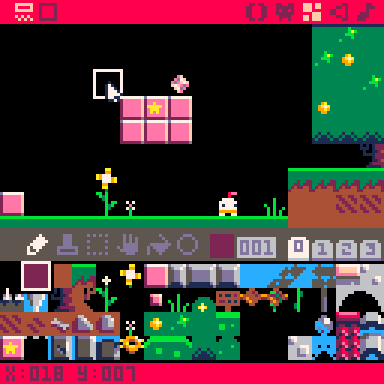
We will use this (18,7) to be the arguments (mx,my). The next arguments are (sx,sy) and we'll leave those at (0,0). Next we need to know how wide and tall the area on the map that we want to draw, so we'll find the bottom-right corner of what we want to draw:
However, the width and height arguments are not the map coordinates. So we must do the math or simply count to get the number of tiles wide and tall:
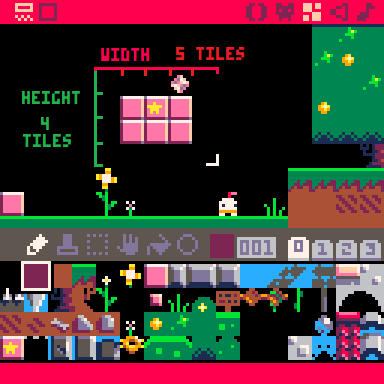
Now we have the arguments we need to draw only this part of the map to the screen:
function _draw()
cls()
map(18,7, 0,0, 5,4)
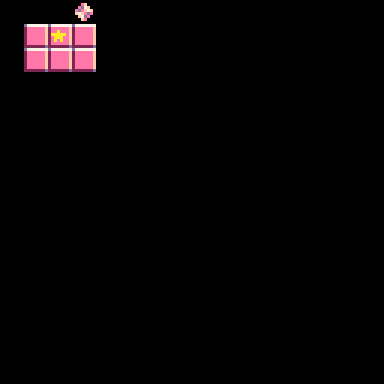
endWe have spaced out the arguments so it is easier to see the mx,my of (18,7), the sx,sy of (0,0), and the w,h of (5,4). And here is what we will see if we run this code in the Jelpi demo cart:
Now that we can control the part of the map that we draw, let's control the part of the screen that we draw it at. Remember that the sx and sy arguments are in pixels, not tiles.
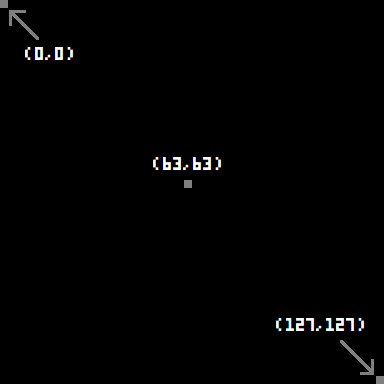
To think with screen coordinates in pixels, remember that the top left is (0,0), the bottom-right is (127,127), and the center is (63,63). You might think I mean 128 and 64, but since we start counting from 0 instead of 1, that means the last visible pixel on the default screen is #127 and the center is #63.
(screen coordinates in pixels)
Knowing that, we can get an idea about where to place something using screen coordinates. Let's say we want to draw those pink blocks where we've drawn this blue rectangle:
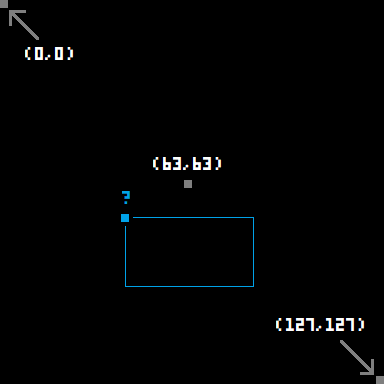
That small blue square in the top-left corner is the pixel we need to use for the screen coordinates of where to start drawing our piece of the map. Since it is to the left of center, then it must be a little less than 63 X, so let's try 40 X. And since it is lower than center, then it must be a little more than 63 Y, so let's try 70 Y. Putting all these arguments together and setting the screen coordinates of sx,sy to be (40,70), the code will become:
function _draw()
	cls()
	map(18,7, 40,70, 5,4)
end
And here is what that will look like:

![]()
Map Layers Argument
The last argument in the map() function allows you to select exactly which sprites from the map to draw to the screen. You may want to do this in order to creates layers of the map, paralax scrolling, or perhaps a game mechanic where you can toggle which tiles on the map are visible.
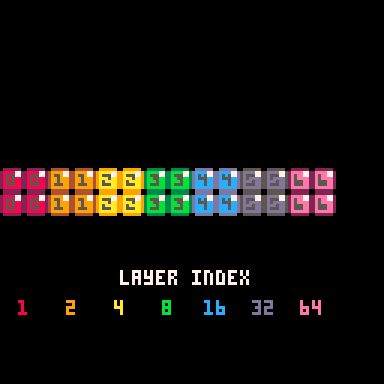
It's a little tricky because you don't just pass flag indexes into this argument. Instead, you pass a layer index which refers to one or more flag indexes. To demonstrate this, we have set up one sprite for each flag that displays the flag color and index on the sprite and we have turned on only that one flag to the corresponding sprite.
Sprite Editor
Map Editor
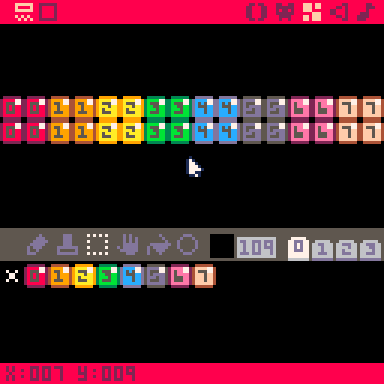
With that prepared, we drew these sprites on the map in larger blocks. Now, when we draw this colorful map to the screen, and turn on specific layers, we will clearly see which flagged sprites are drawn using which layer index value. Let's first explain what we mean by the difference between a flag index and a layer index.
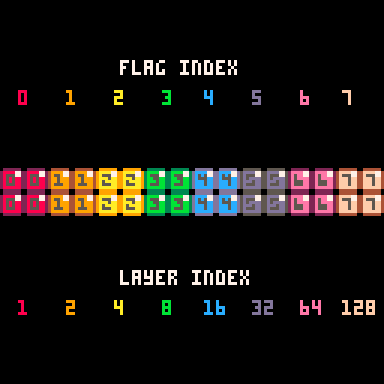
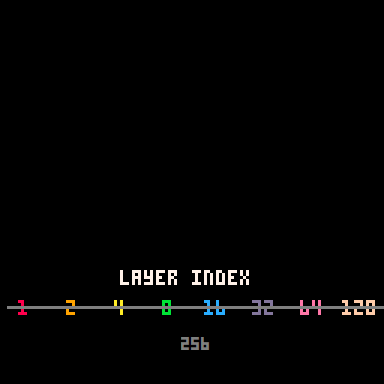
The flag index is straight forward and we are already displaying it in each of the sprites. The layer index for each flag begins at 1, and ends at 128. This is because there are 256 different combinations of these 8 flags. So you can pass any number from 0 to 256 to the layers argument, and you will draw one unique combination of sprite flags to the screen.
For example:
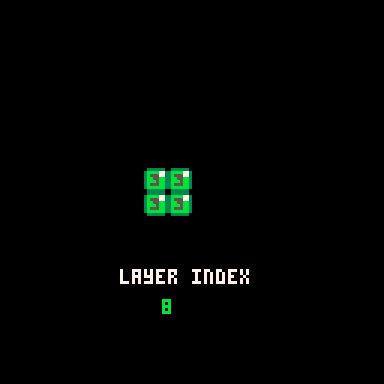
layers = 0 --default, all sprites

function _draw()
	cls()
	map(0,0, 0,0, 16,16, layers)
end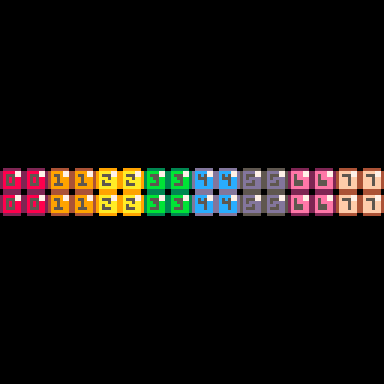
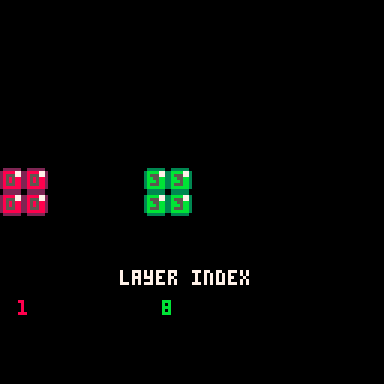
But if we change layers to 1, that matches the layer index of flag #0, and so only sprites with the first flag are drawn:
layers = 1

function _draw()
	cls()
	map(0,0, 0,0, 16,16, layers)
end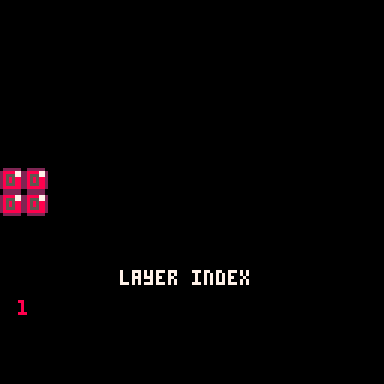
Next, if we change layers to 2, that matches the layer index of flag #1, and so only sprites with flag #1 are drawn:
layers = 2

function _draw()
	cls()
	map(0,0, 0,0, 16,16, layers)
end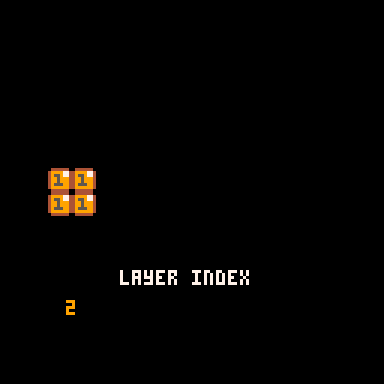
However, here is where it gets tricky and where it also starts to make sense. If we change layers to 3, that no longer matches any layer index of a specific flag, but layer indexes 1 and 2 do add up to equal 3:
layers = 3

function _draw()
	cls()
	map(0,0, 0,0, 16,16, layers)
end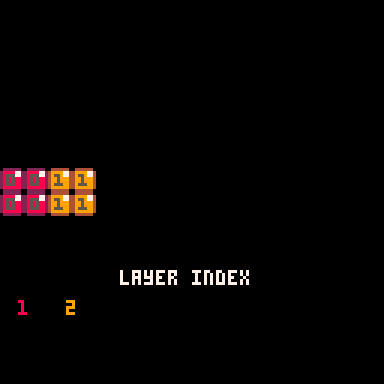
And so we have found our first layer index that creates a combination of multiple sprite flags. This pattern continues so that when the layers argument matches a layer index of one flag, then only that flag is drawn, otherwise the layers argument is a combination of layer indexes that add up to the layers value.
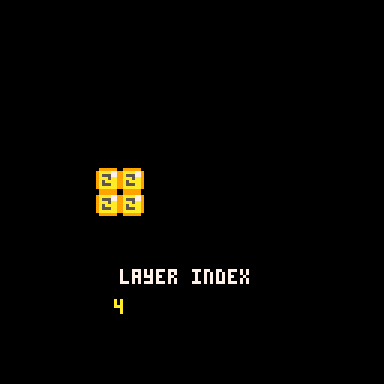
layers = 4
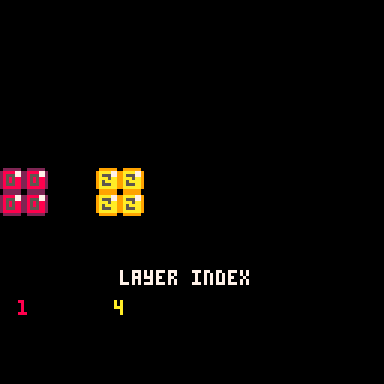
layers = 5
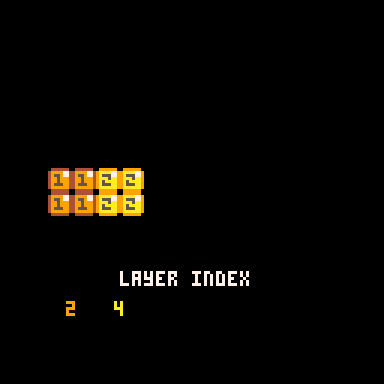
layers = 6
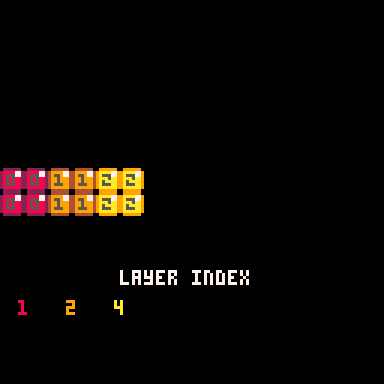
layers = 7
layers = 8
layers = 9
Here are some more random numbers between 0 and 256. If you add each of the flag's layer index, you will always get the value we set in the layers argument.
layers = 85
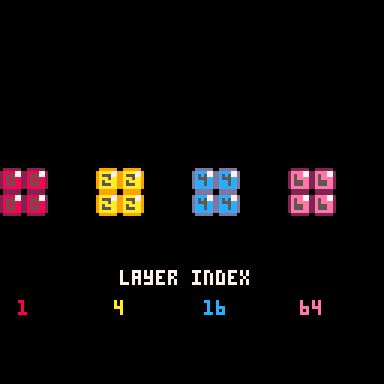
layers = 145
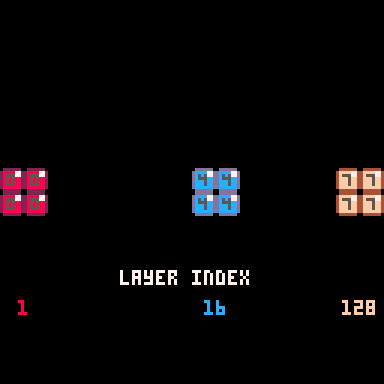
layers = 127
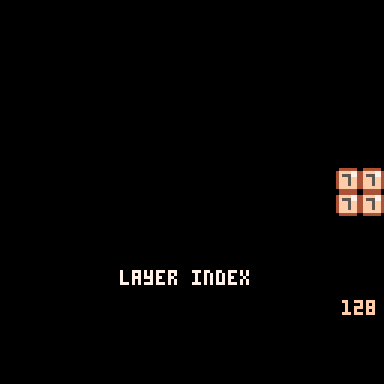
layers = 128
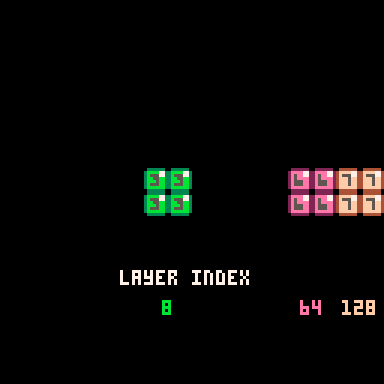
layers = 200
layers = 255
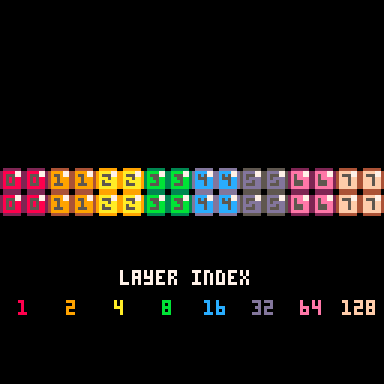
Notice that when the layers argument is 255, it looks the same as the default of 0, but it will not draw sprites that do not have flags. If we increase the value by just one more to 256, then it will not draw any sprites at all, whether those sprites have flags or not.
layers = 256
Now that you understand how the layers argument works to add up the layer indexes of each flag, you don't have to actually figure out the layers value for just the right combination of flags. Instead, you can simply pass the sum of layer indexes.
So you can make it easier on yourself like this:
flag_0=1
flag_1=2
flag_2=4
flag_3=8
flag_4=16
flag_5=32
flag_6=64
flag_7=128

layers = flag_4 + flag_6

function _draw()
	cls()
	map(0,0,0,0,16,16,layers)
end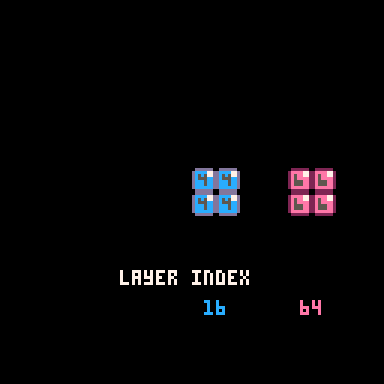
![]()
1571
12 Apr 2023